Printing and Export
Automata Lab can print a structured report from one immutable project revision or export the complete State Chart as an image. Both workflows are output operations: they do not Save or mutate the project, change its association, increment its revision, alter Undo history, or update the hosted server.
The States report includes Terminal State as Yes or No. Chart images and printing retain terminal notation regardless of the Simulator preference, including Print before the first Chart visit. Reports capture one document revision; the enablement preference, live termination status and traces are excluded.
Page Setup
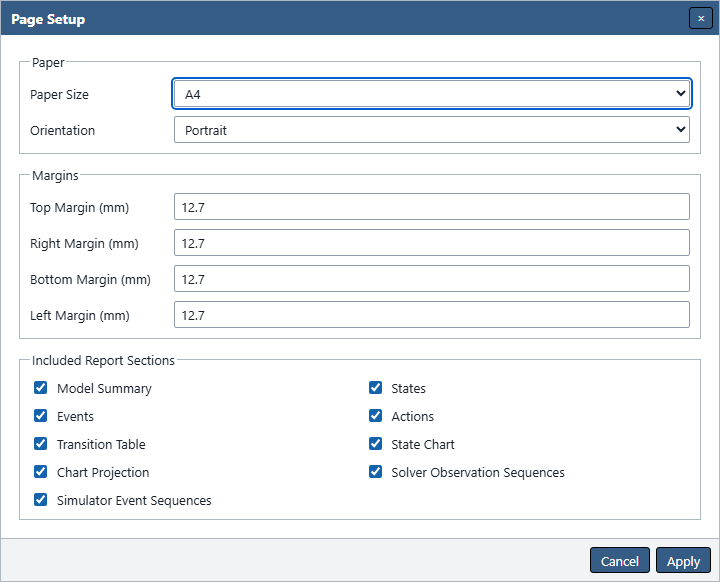
Choose File → Page Setup with or without an open project. The dialog edits a draft of global application preferences, not model-file content.
| Group | Choices and defaults |
|---|---|
| Paper Size | A4, Letter, or Legal; default A4. |
| Orientation | Portrait or Landscape; default Portrait. |
| Margins | Independent Top, Right, Bottom, and Left values from 0 through 50 mm; each defaults to 12.7 mm. |
| Included Sections | Nine independent checkboxes; every section defaults selected. |
Choose Apply to validate and commit the complete draft and close the dialog. Cancel, Close, or Escape discards every pending Page Setup change. Applied values remain synchronized with the matching section preferences in Application Settings → Print.
Figure UG-25 shows the complete Page Setup dialog. Set the report's appearance separately in Print Settings.
Paper Size and Orientation
Paper Size and Orientation produce the report's print-page rule before the browser print dialog opens. Landscape swaps the usable page dimensions; it does not rotate project data or the State Chart itself.
The browser and printer ultimately control available destinations, hardware margins, scaling options, and media support. If a selected printer cannot provide the configured paper, use its native print controls to choose an available destination or media without changing the Automata Lab project.
Margins
Top, Right, Bottom, and Left are separate millimetre values. Each accepts one decimal place from 0 through 50 inclusive. Committing an out-of-range typed draft snaps it to the nearest limit.
These are report preferences and are not written into the Automata Lab JSON file. Cancelling Page Setup restores the previous committed values and does not affect document dirty state, revision, or history.
Report Sections
Page Setup and Application Settings → Print → Sections edit the same nine booleans:
- Model Summary
- States
- Events
- Actions
- Transition Table
- State Chart
- Chart Projection
- Solver Observation Sequences
- Simulator Event Sequences
Each selected main section starts on a new page. State Chart and Chart Projection are independent: State Chart is the rendered UML-style diagram, while Chart Projection is the separate technical record of saved Chart geometry.
Tables preserve the complete stored content. Ordered action assignments and Solver or Simulator sequences print one item per line in order, including duplicates, without collapsing or abbreviating them.
Academic and Industry Styles
Choose the report style under Application Settings → Print → Style and Format.
| Style | Appearance |
|---|---|
| Academic | Default. Times New Roman with journal-style top, heading, and bottom rules and no vertical or internal cell grid. |
| Industry | Sans-serif text, grid tables, and a 20-percent gray fill on each table heading row. |
Figures UG-27 and UG-28 show the same complete States page with identical paper and margins. Open each image at full size to compare table details.
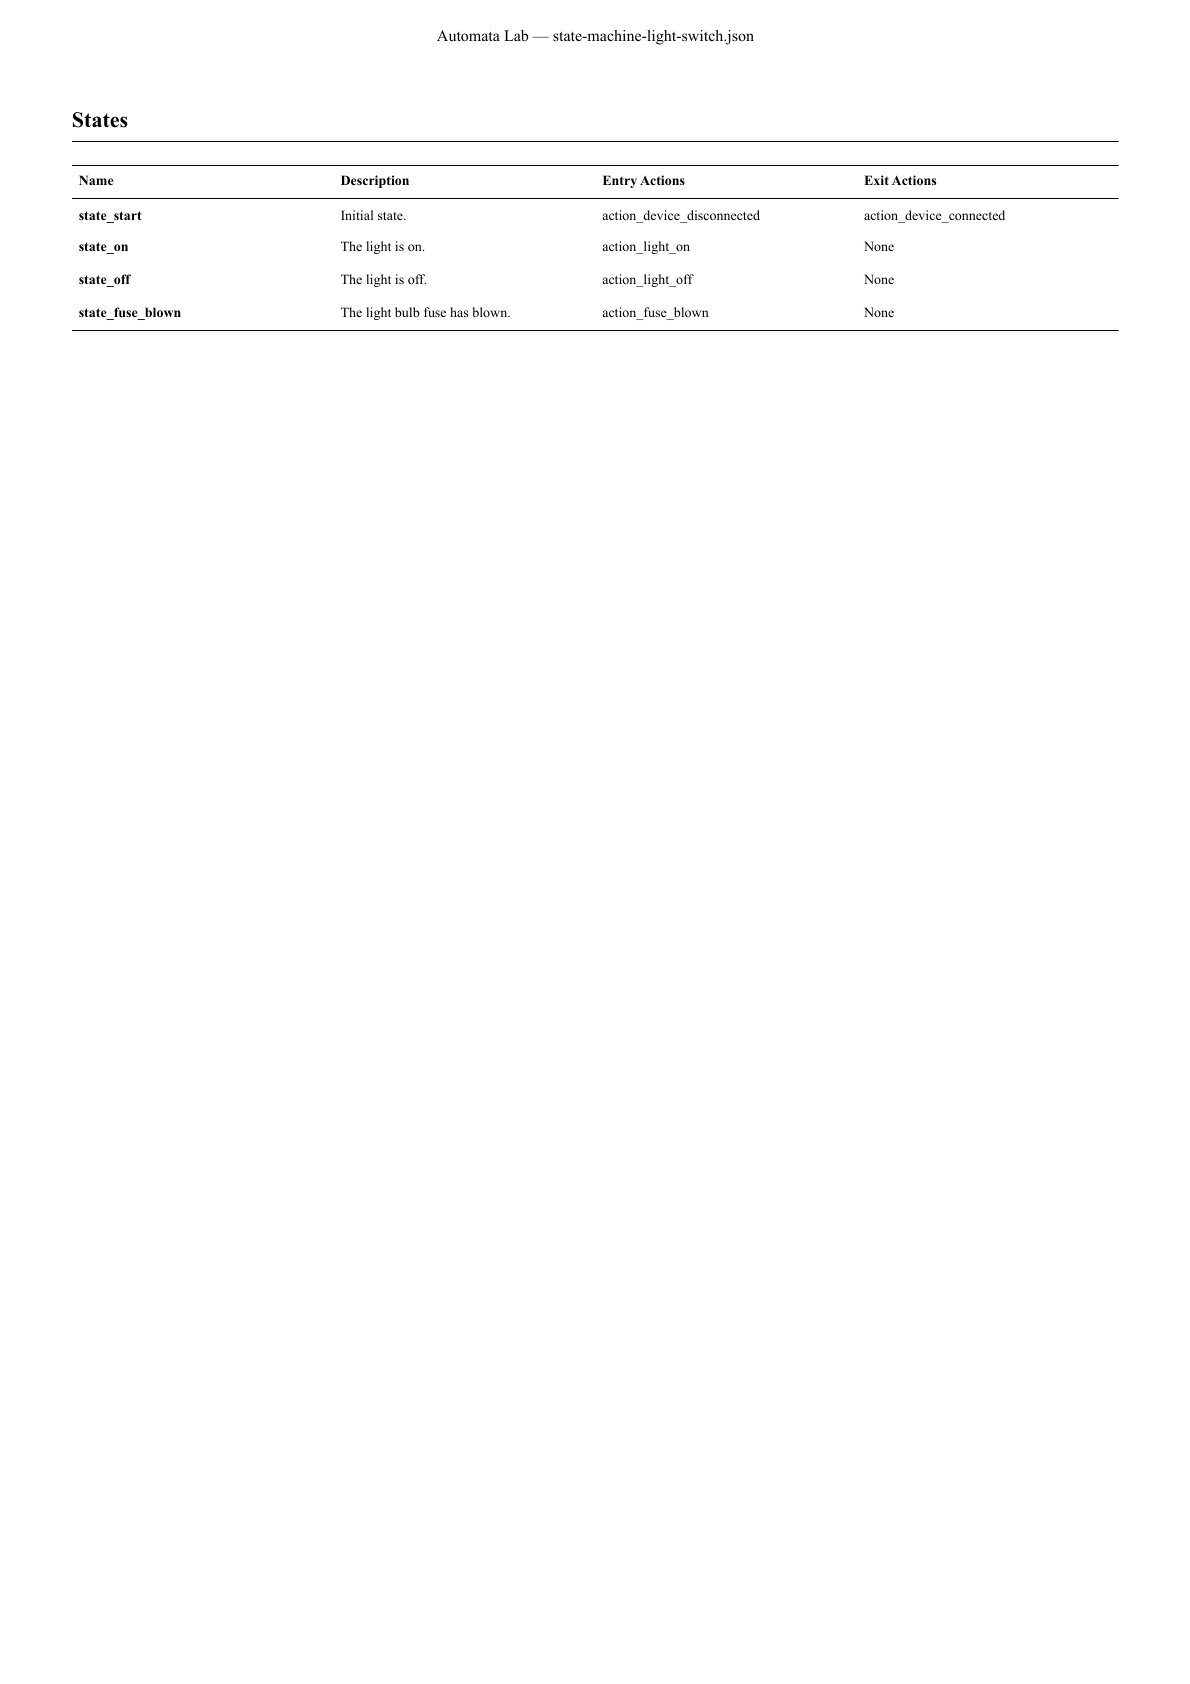
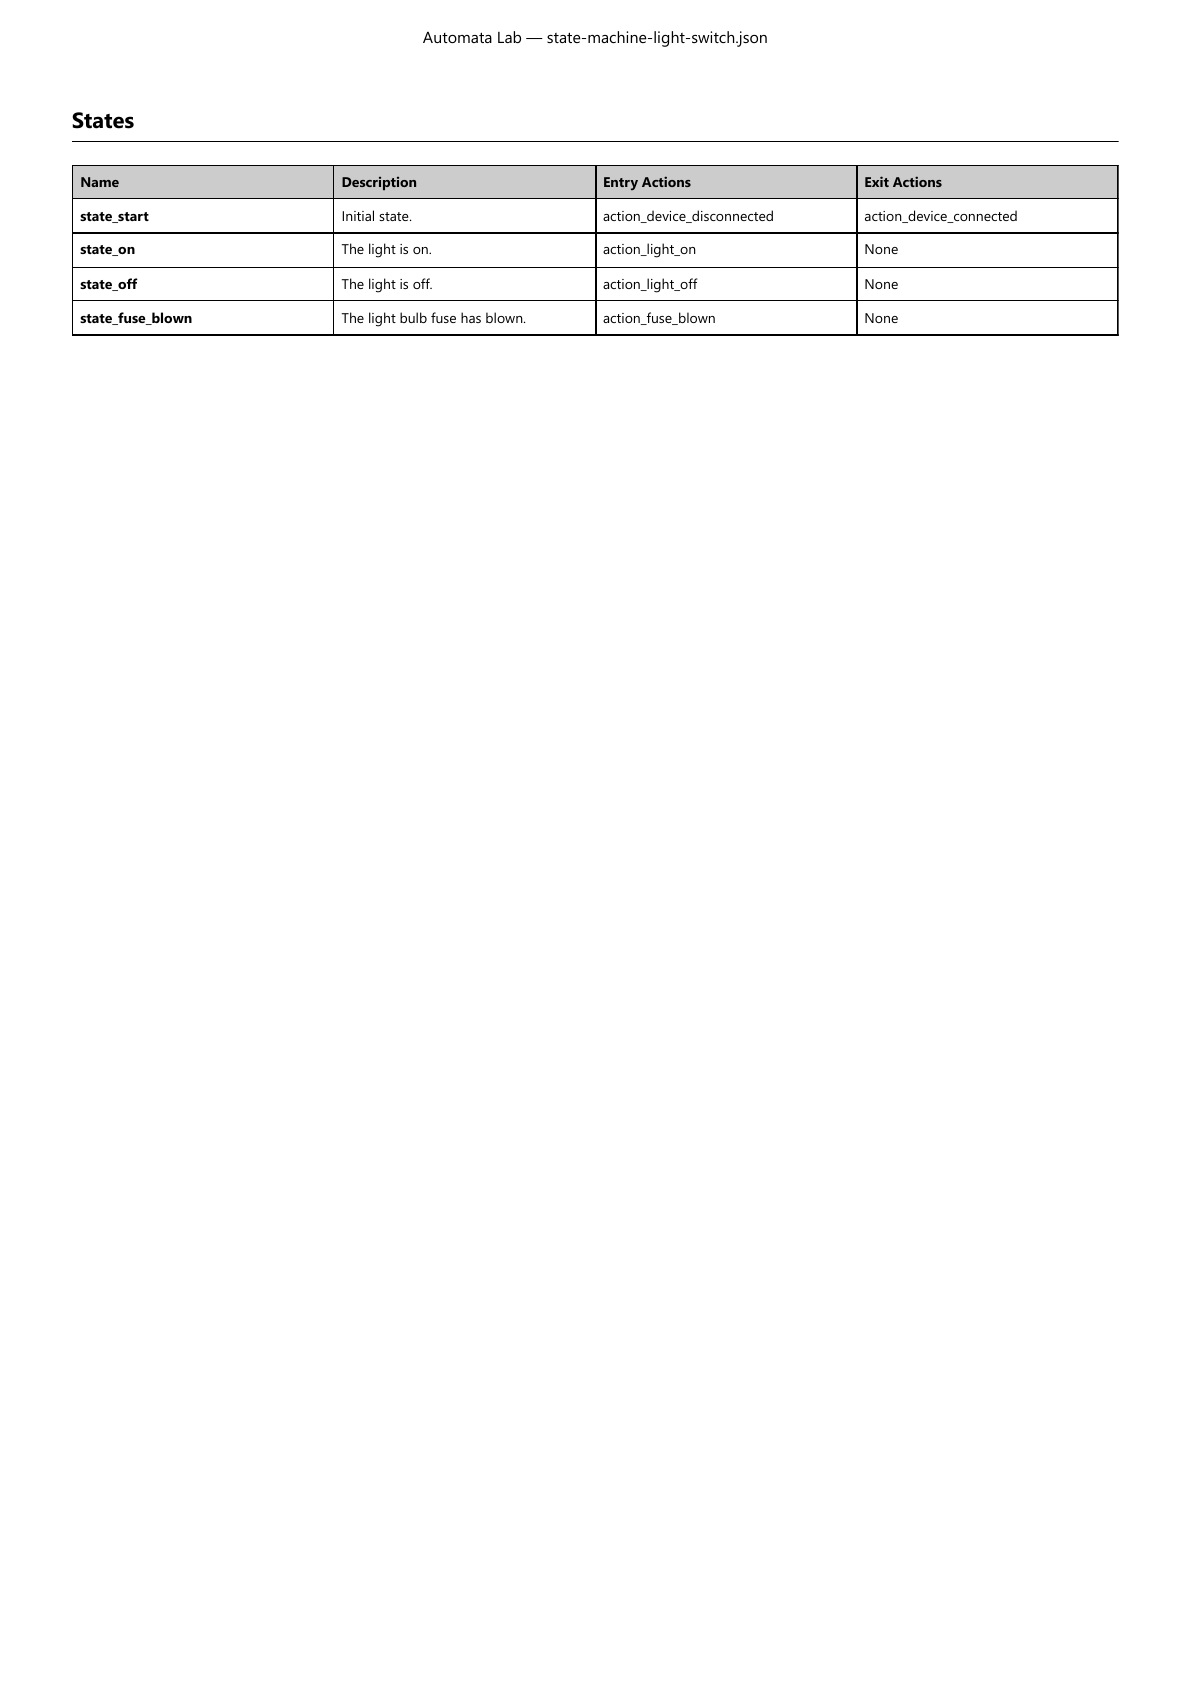
Both styles remain legible in color and monochrome. Where the browser supports it, table headings repeat across pages. Every page has a centered running header containing Automata Lab and the captured file name. The first page separately shows the document or model title.
Style and section choices are application preferences. Changing them never edits the project and does not travel with a saved JSON file.
Printing Complete and Incomplete Projects
Choose File → Print for any open authoring project. A structurally sound project with no states and/or no initial state can still produce a useful authoring report without the incomplete-project confirmation used by Save. A second print request is ignored while the current print operation is pending.
Print captures one document revision and the currently committed Print preferences before it builds a control-free report and opens the browser print dialog. Later edits cannot alter that pending snapshot.
The report contains only selected document-owned content, plus the derived State Chart image described below. It excludes transient Solver candidates, the hosted project, live Simulator session and traces, Console entries, selection, viewport, open dialogs, status, menus, splitters, buttons, and other interactive state.
The report identifies the model, file version, and captured document revision. Cancelling the browser print dialog returns to the application without changing the project, association, revision, dirty state, or history.
State Chart in Printed Reports
When selected, State Chart renders the captured project through the same sanitized scene compositor used by Save As Image. The print-specific capture includes complete bounds, nodes, indicators, routed transitions, arrowheads, labels, clipping, and derived geometry.
For predictable paper output, it always uses:
- Light theme;
- A transparent background;
- Black text throughout;
- No grid;
- No selection, focus, endpoint, resize, debug, or application chrome; and
- The PNG raster branch without opening a save picker.
Automata Lab paints transition-label glyphs and the UML terminal indicator's inner disc before handing the report to the browser. It bounds and, when necessary, uniformly downscales the raster so the complete State Chart fits one page. Chart Projection follows only when its separate report section is also selected.
The printed image is derived from the captured document and does not serialize routes or mutate Chart geometry.
Figure UG-29 shows the actual report output for the light-switch example. It is separate from the interactive Chart screenshot in Figure UG-07.
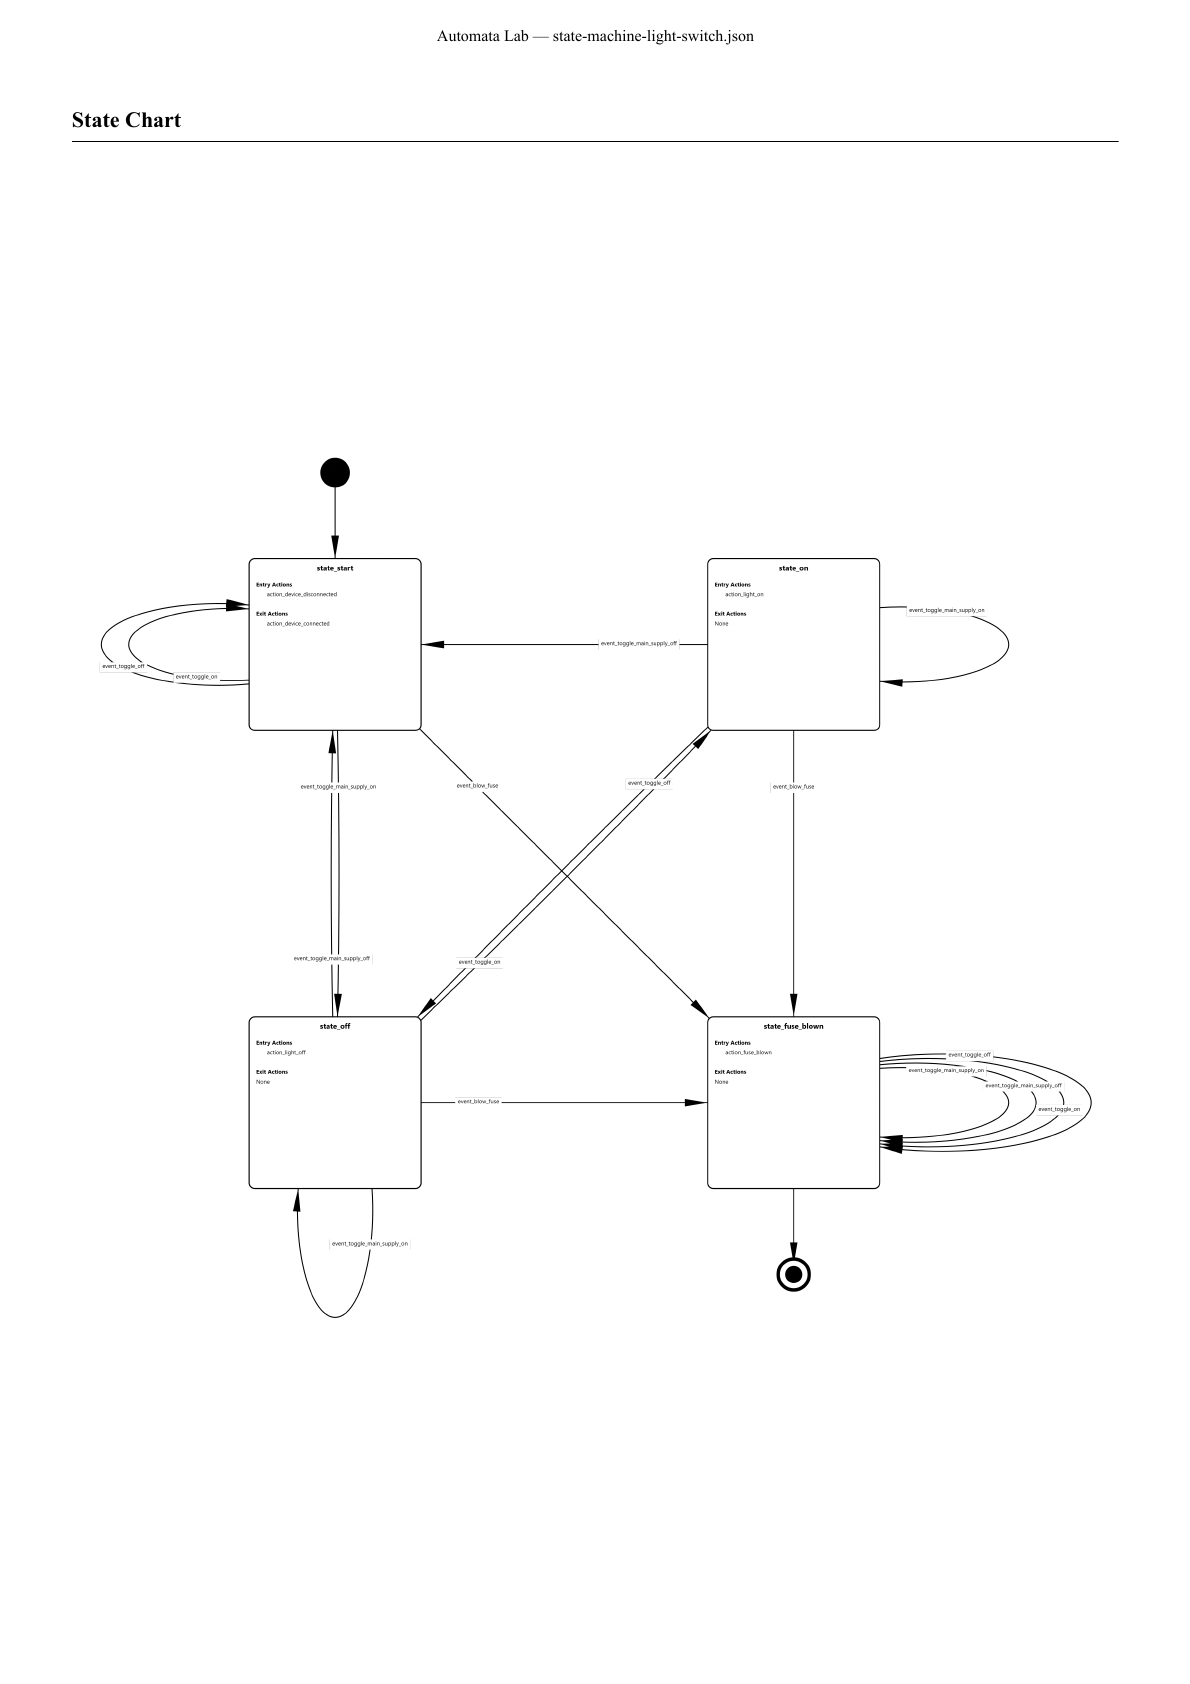
Chart Image Export
On Chart, choose Save As Image after configuring Application Settings → Chart → Image Export. The command captures one immutable snapshot of the complete current Chart and proposes a sanitized name in the form <model-name>-chart.<extension>.
The export contains every visible Chart node, relation, arrowhead, and label plus one Grid Size of padding. It uses the current theme and includes the grid only when Show Grid is enabled. It excludes the Palette, zoom controls, attribution, bottom action panel, status, selection, focus outlines, endpoint controls, resize handles, and debug overlays.
A capable browser opens one native picker restricted to the selected format. A browser without that capability downloads the same suggested name and reports the location limitation in contextual status. Cancelling is a non-error and produces no project or Console change.
Invalid dimensions, raster-limit excess, encoding failure, or write failure opens an actionable error and records a Console diagnostic.
The Image Export settings screenshot shows the format, transparency, unit, DPI, and raster limit used by this command.
SVG and Raster Formats
Image Export supports PNG, JPG, and SVG.
| Format | Behavior |
|---|---|
| PNG | Raster output with alpha support; uses DPI and the Maximum Megapixels preflight. |
| JPG | Raster output without alpha; keeps an opaque background and uses DPI and the megapixel preflight. |
| SVG | Vector output with inert text and no scripts, event handlers, active content, or external resources. |
Transparent Background is available for PNG and SVG. When enabled, the export omits both canvas background and grid because the grid has no surface. JPG does not support alpha, so the control is disabled and an opaque background is retained.
Unit can be Inches, Centimetres, or Pixels. CSS Chart geometry uses 96 CSS pixels per inch. Inches and Centimetres set physical dimensions and metadata; Pixels reports CSS-pixel dimensions. DPI always means dots per inch and does not change meaning when Unit changes.
Raster PNG and JPG scale destination dimensions from the configured DPI, which accepts 72 through 1,200 and defaults to 300. SVG retains vector geometry, disables DPI without erasing its stored value, and declares dimensions in the selected unit.
Maximum Megapixels
Maximum Megapixels bounds PNG and JPG Canvas allocation. It accepts whole values from 1 through 1,000 and defaults to 1,000.
Before allocating the raster bitmap, Automata Lab multiplies the destination width and height and compares the result with this preference. If the request is too large, export fails before allocation and the error names the configured limit. Reduce DPI, reduce the Chart's complete bounds, or raise the preference within its allowed range before retrying.
SVG does not allocate a raster Canvas and therefore does not consume DPI or Maximum Megapixels. Both numeric values are retained while SVG is selected so returning to PNG or JPG restores the prior raster settings.
Previous: Files and Data Exchange
Next: Application Settings