State Chart
Chart is the visual authoring surface for the same state machine edited in Editor. Semantic changes made on either surface appear on the other. Chart also stores presentation-only state placement, UML indicators, and unconfigured draft transition lines.
Chart Overview
Select Chart in the Model tree. The page contains a narrow Palette, the zoomable and pannable Canvas, and a bottom action panel with Automatic Layout, Fit Chart, and Save As Image.
The Canvas uses a top-left coordinate origin. Viewport zoom and pan do not change project geometry, dirty state, routing input, or image-export bounds. A new empty Chart opens at 100-percent zoom with its top-left origin at the Canvas origin. After a successful File → Open or File → Pull Model from Server, the first visit to Chart fits the loaded model once. Palette drops, state and transition edits, preference changes, Undo/Redo, and later visits do not repeat that fit. Use Automatic Layout or Fit Chart whenever you want to fit the diagram again.
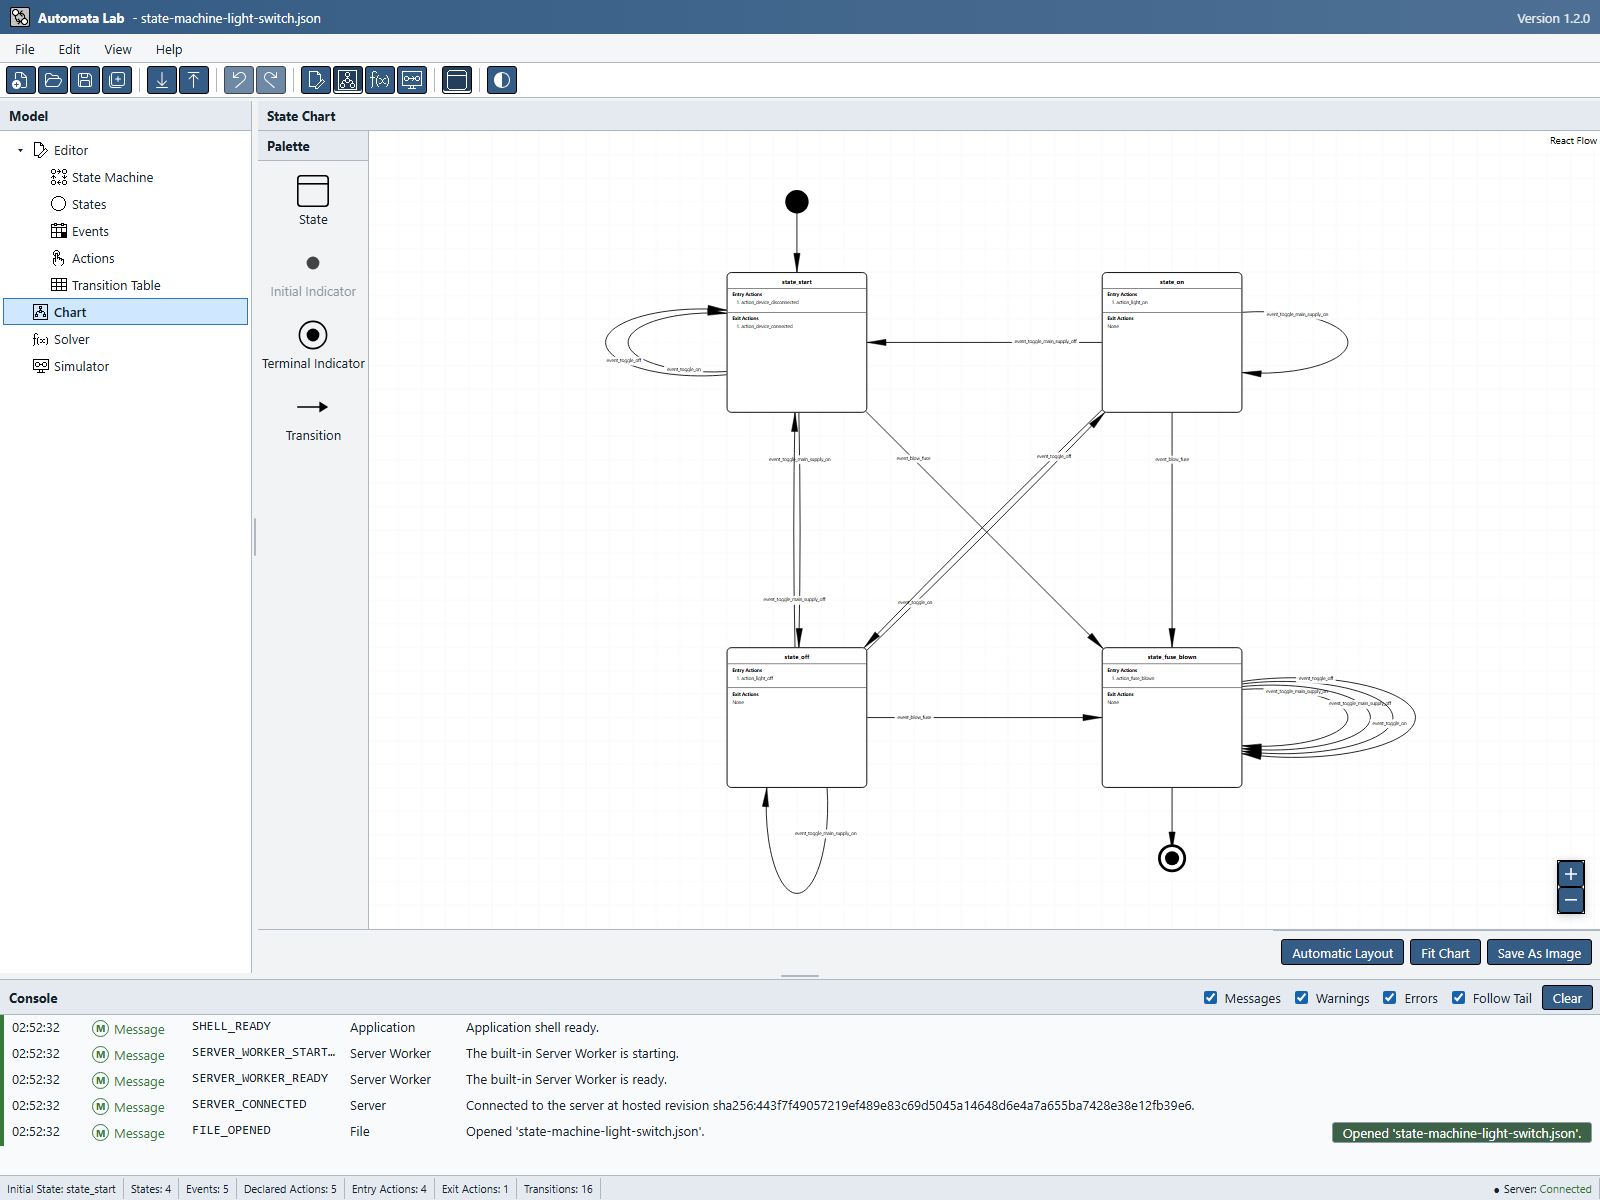
Figure UG-07 identifies the Palette and Chart commands and shows the example's initial and terminal notation.
Palette
The Palette stays vertically arranged beside the Canvas, including at narrow widths. Its width follows the longest unwrapped icon label, with space beside the tiles and between them and the right pane edge or scrollbar. The Canvas takes the remaining width. The Palette title bar spans the pane and matches the State Chart title bar in height and color. Tiles and icons keep their theme appearance independently of both button-color settings; Automatic Layout, Fit Chart, Save As Image, and Canvas zoom buttons use Application Buttons instead.
The Palette contains four labelled icon tiles with smooth 32-by-32-CSS-pixel glyphs:
| Item | Drop result |
|---|---|
| State | One generated semantic state and its Chart placement. |
| Initial Indicator | The single UML initial indicator, connected or orphaned. |
| Terminal Indicator | One chart-only UML final indicator, connected or orphaned. |
| Transition | One chart-only draft with two independent endpoints. |
All four controls are drag-only placement sources. Clicking them or pressing Enter or Space is intentionally inert. The Initial Indicator remains visible but disabled while the single indicator already exists. While dragging, a copy of the chosen 32-by-32-CSS-pixel icon follows the pointer; its label and surrounding Palette tile are not part of the drag image.
Creating States
Drag State to the Canvas. One atomic command immediately creates an empty-description state using the lowest unused positive name in the form state_N and records its placement.
Double-click the new state, or focus it and press Enter or Space, to open Edit State. Renaming it uses the same reference-safe command as Editor, so transitions, action assignments, initialization, and Chart references remain synchronized. A state created in Editor can exist without a placement; Chart gives it a deterministic placement when a visual operation needs one.
Collapsed states show only the state name. Expanded states also show ordered Entry Actions and Exit Actions, including duplicates. Use View → Expand Chart States or the matching toolbar command to switch the document-wide Chart presentation.
Initial Indicator
Drag Initial Indicator into open space to create an orphan without changing the semantic initial state. Drop it on a state to select that state as initial and position the filled UML dot above it. Placement, semantic initialization, and any required collision displacement commit together.
A connected initial relation is the only visible initial-state notation; the state node does not repeat it with a badge. Deleting the state-connected initial relation clears the model's initial state and leaves the dot unconnected at its current position. You can reconnect it to the same state. Save and Save As remain available; saving before reconnection uses the normal missing-initial-state warning. Deleting a connected indicator clears initialization and removes the dot. Deleting an indicator with no state attachment removes only Chart data, preserving any initial state selected in Editor. Undo and Redo restore the connection and initialization together. Direct initial-to-terminal links are independent: creating or deleting one never changes initialization. Changing initialization in Editor updates a state-attached indicator but leaves a state-unattached indicator without a state relation.
In Figure UG-07, the filled dot above state_start supplies this notation.
Terminal Indicators
Drag Terminal Indicator into open space to create an orphan, or drop it on a state to place it below that state and mark the state terminal and create its relation. One state may have at most one terminal-indicator relation, while one indicator may receive relations from several states.
The connection and the state's Terminal State checkbox are synchronized atomically. Checking the box creates missing notation; unchecking removes that state's relation while retaining the indicator. Deleting a relation clears its state's flag; deleting a shared indicator clears every connected state's flag. Undo restores the complete flag/notation snapshot. Reconnecting to another indicator retains membership.
Notation stays visible whether Enable Terminal States is on or off. The preference controls execution only and is captured at Start Session or Reset. Orphan indicators, unfinished drafts and direct initial-to-terminal links remain visual and do not mark states terminal.
Double-click a terminal indicator, or focus it and press Enter, to choose its source state through the textual dialog. Replacing a relation is explicit when the chosen state is already connected to another terminal indicator.
The ring beneath state_fuse_blown in Figure UG-07 is a terminal indicator; the completed Simulator run shows the session retaining that state.
Creating and Configuring Transitions
Drag Transition to create a persisted unconfigured draft. A draft has no transition-table row and no semantic or runtime effect. Drag either endpoint onto a state to attach it. The curve and visible endpoint grip meet the state outline, including when the other end is still free. It follows subsequent state movement, resizing, and layout until you drag it away. Source and target can attach in either order, to different states or to the same state for a self-loop.
Figure UG-09 shows the intermediate draft after only one endpoint has been attached.
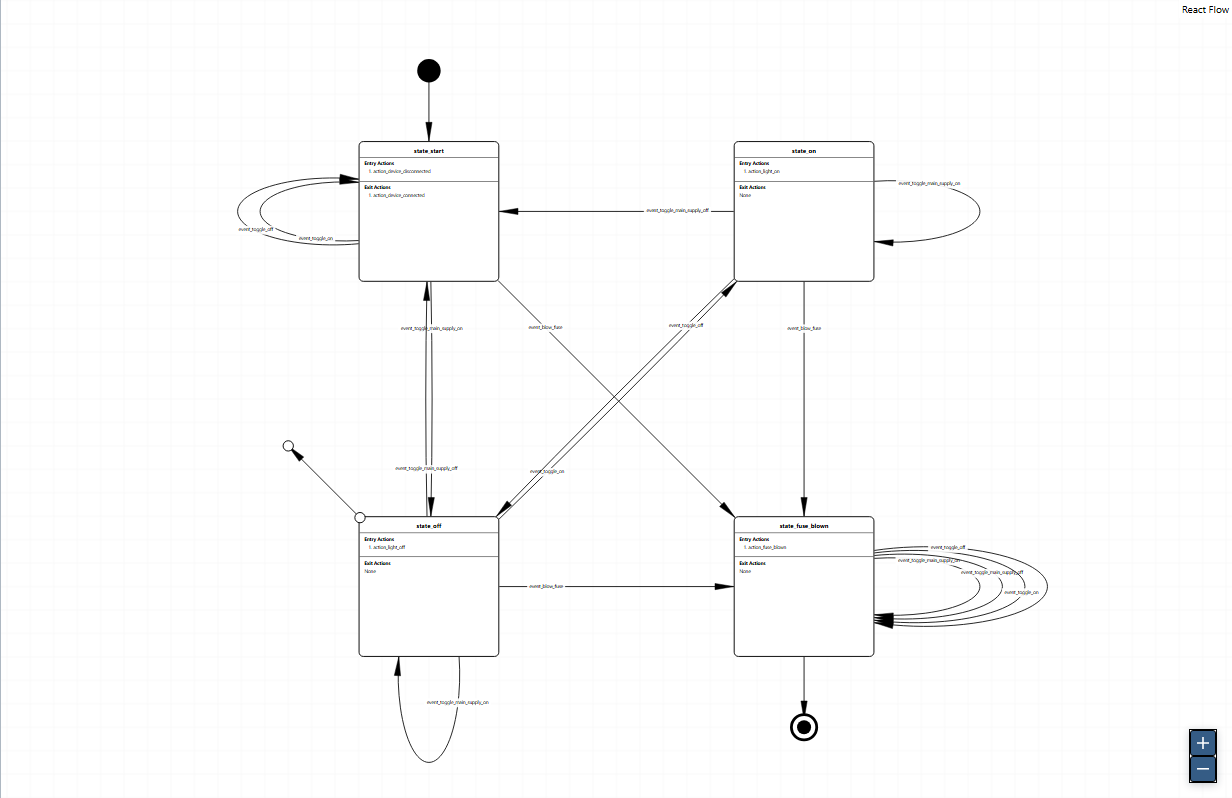
Selecting a draft makes its line thicker; it does not draw a rectangle around the line. Drafts use the same automatic routing, obstacle handling, parallel lanes, and self-loop shapes as existing transitions.
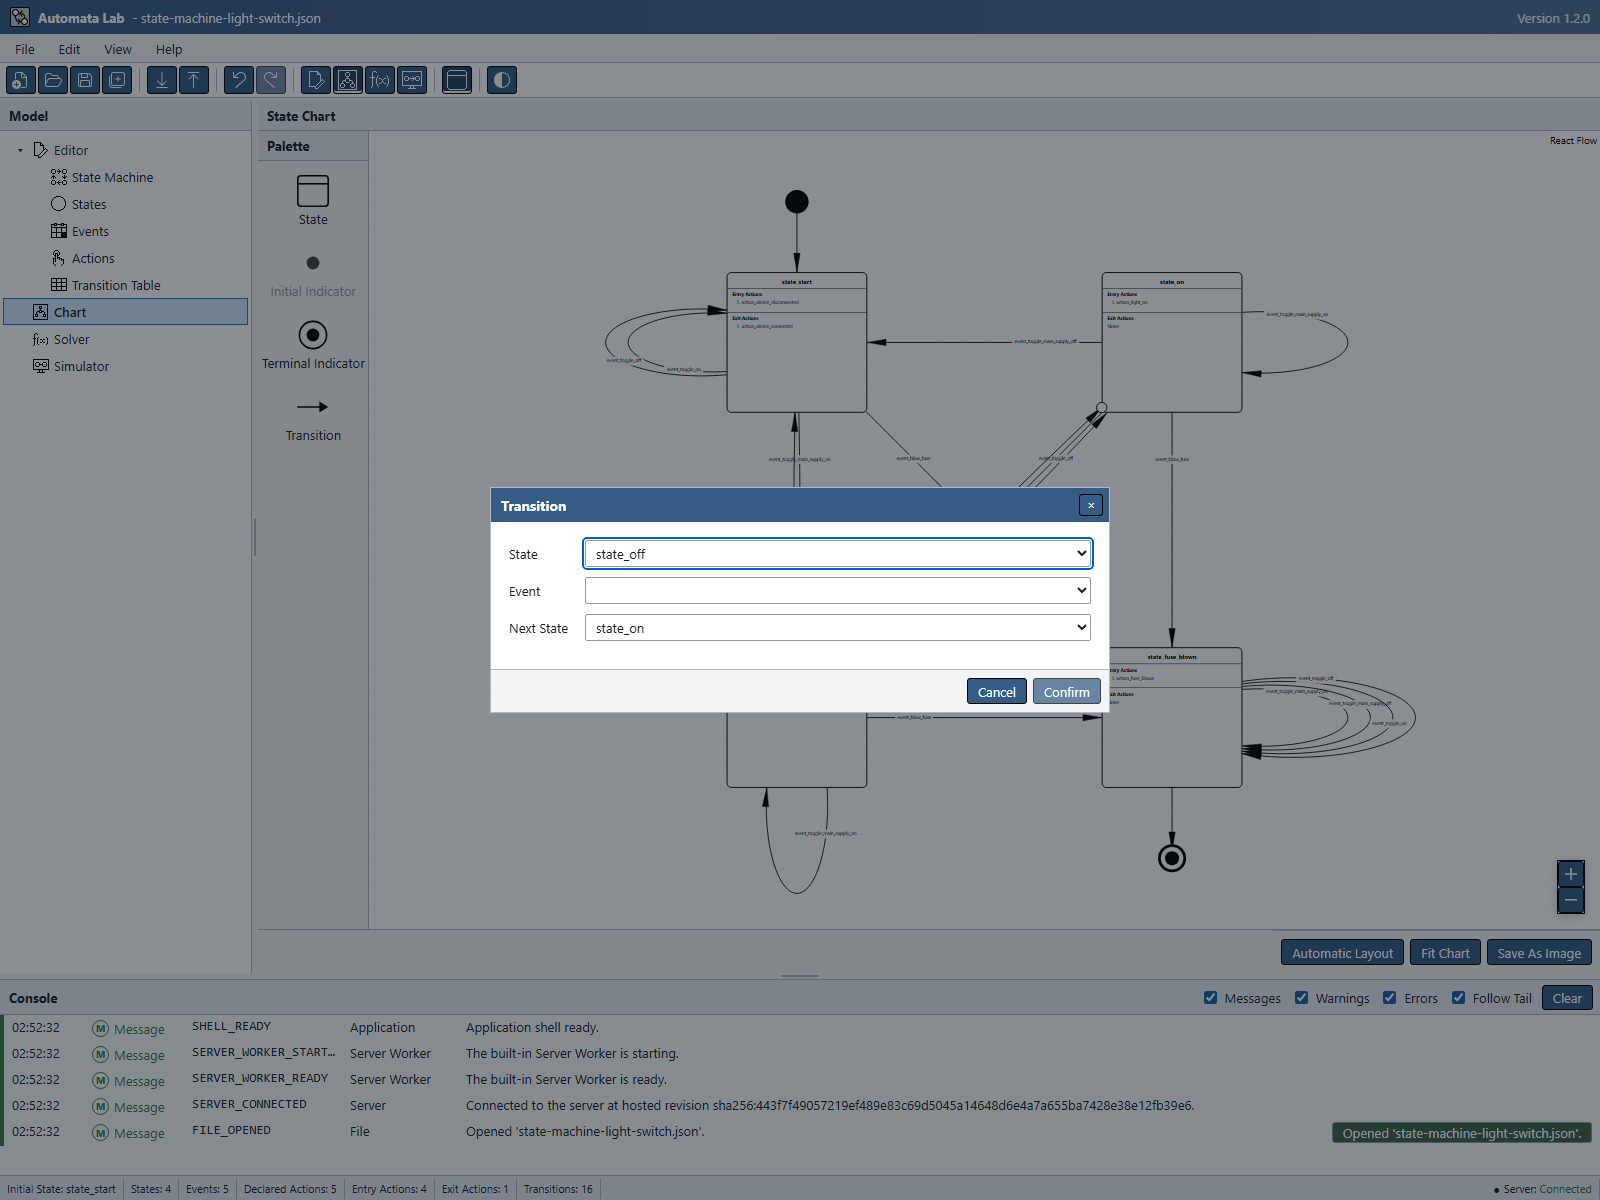
For a new Palette draft connecting two states, the first attachment leaves it on the Chart. Attaching the second endpoint opens Transition with State and Next State populated according to endpoint roles and Event empty. Choose an event and Confirm to atomically replace the draft with one semantic transition. Duplicate keys, invalid references, and stale edits preserve the draft.
Figure UG-10 shows the dialog opened by the second state attachment, with the endpoint roles already filled in.
Cancel or Escape retains both connections. To finish later, double-click the draft or either endpoint grip, or focus one and press Enter or Space. This also works when both grips sit on the same state. Keyboard arrows move a focused endpoint; entering another state attaches it, while movement beginning inside the same state advances normally and releases the attachment.
Moving a whole draft moves its free endpoints; attached endpoints stay with their states. Deleting an attached state keeps the draft and releases that end at the state's last displayed center. Rename, Undo, and Redo preserve the appropriate references. Save/Open retains attachments; loading or undoing a draft never opens a dialog automatically.
Double-click or right-click a configured transition, or focus it and press Enter or Space, to edit it. The Editor Transition Table remains the complete textual alternative.
Moving and Resizing States
Drag one state or a multi-selection to move it. A completed gesture commits its coordinates once; individual pointer pixels do not create separate history entries. With Snap to Grid enabled, movement follows the configured Grid Size.
Collapsed width and height and expanded width are application preferences and cannot be resized on the Canvas. Only an expanded state's height is resizable through its top and bottom handles. The effective height can never be smaller than the configured expanded minimum or the measured content requirement. Both square grips measure 10 by 10 CSS pixels before zoom, with 2-pixel borders matching unselected states and 28-by-28 pointer targets. They sit centrally just outside the top and bottom edges at mirrored positions; selection does not add horizontal resize lines.
The saved enlarged height survives collapse and re-expansion. One completed resize is one document revision and one Undo record. Press Escape before pointer release to cancel a resize preview without mutation.
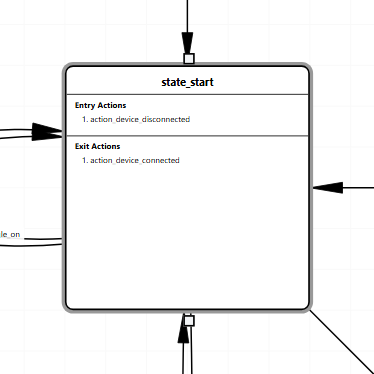
Use the square grips shown in Figure UG-08 to adjust expanded height.
Connecting Transitions to Indicators
Drag Transition from the Palette onto the Canvas, then drop either endpoint onto the visible circle of an initial or terminal indicator. You can attach the indicator or the state first. The first attached end follows that element when it moves, and its grip sits on the element outline even while the other end is free.
| Completed pair | Result |
|---|---|
| Initial indicator and state | Select that state as the model's initial state and connect the initial indicator. |
| State and terminal indicator | Mark the state terminal and create or replace its connection. |
| Initial indicator and terminal indicator | Create a visual initial-to-terminal connection without changing the model's initial state or its existing initial-state connection. |
The arrow turns immediately when you drop the wrong end onto an indicator, even if its other end is still free. Dropping the arrow end onto an initial indicator reverses the line to point away from it; dropping the start onto a terminal indicator reverses the line to point toward it. The attached grip and free end stay in their Canvas positions, and keyboard focus stays with the grip you moved.
No Event dialog opens for these pairs. If the same initial/state or state/terminal connection already exists, completing the new line removes the unfinished copy and keeps the existing connection without an error or duplicate line. An initial-to-terminal connection that already exists is rejected. Terminal-to-terminal links and indicator self-loops are not supported. Undo/Redo and opening a saved file restore the recorded line direction without changing it.
For keyboard placement, select the draft endpoint and use the arrow keys to move it into the indicator circle. Moving an attached endpoint away detaches it. Enter, Space, or double-click on an unfinished indicator draft focuses its free endpoint so you can finish the connection. Half-connected drafts and completed visual links survive Save/Open and Undo/Redo. Deleting an indicator releases any attached draft ends and removes its visual connections; Undo restores them. Select a completed direct indicator connection and press Delete to remove that line.
A detached semantic transition that remembers an event can reconnect to states. Dropping it onto an indicator is rejected and preserves its event, attachments, and position. Use a fresh Palette transition for indicator connections.
Editing Transition Endpoints
Selecting a configured semantic transition exposes source and target controls at its visible clipped endpoints. Drag a control onto the opaque body of another state to change that semantic source or destination while preserving the event.
Drag a configured endpoint into empty Canvas space to detach it. The transition is removed from the model, while its line stays on the Chart with the event remembered and the other end still attached. You can detach both ends, move either free end, and reconnect them in either order. Reconnecting the last free end automatically restores the transition using its remembered event, including when both ends connect to the same state. No event dialog is needed.
Figures UG-11 and UG-12 show the same light-switch transition before and after reattachment. Compare the line and the status-bar transition count.
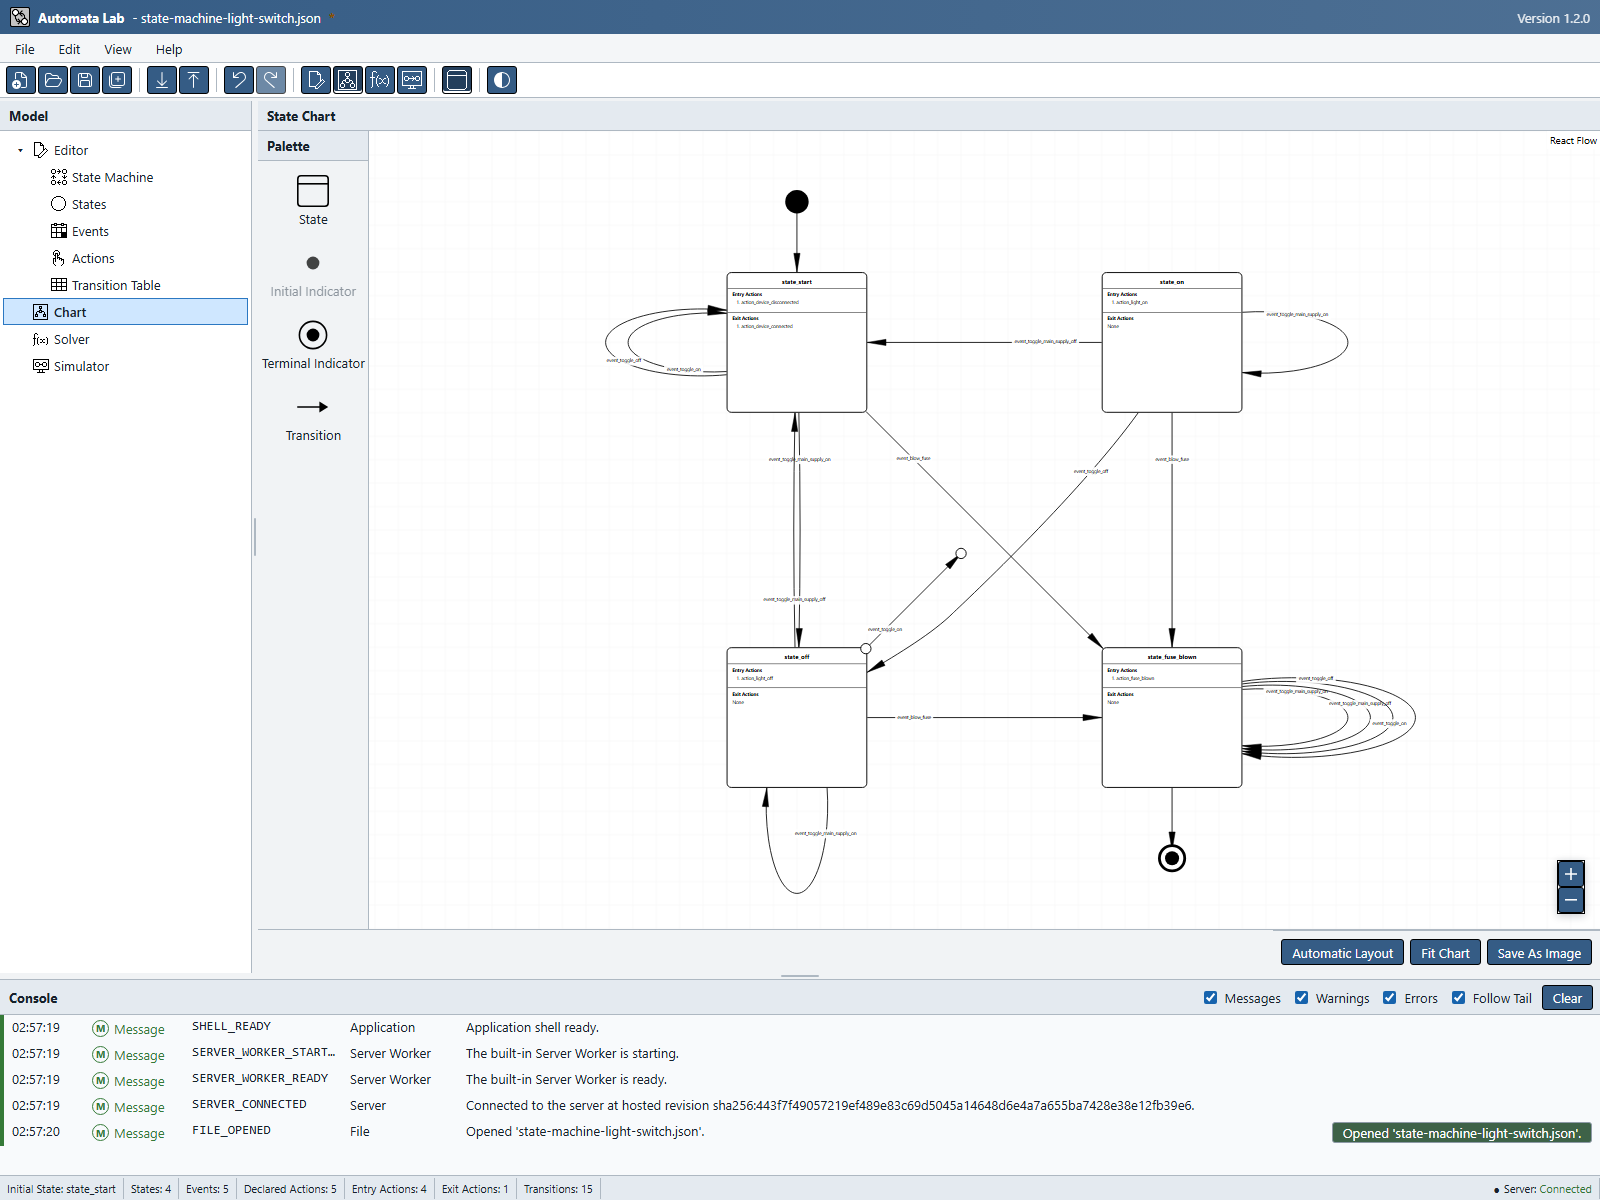
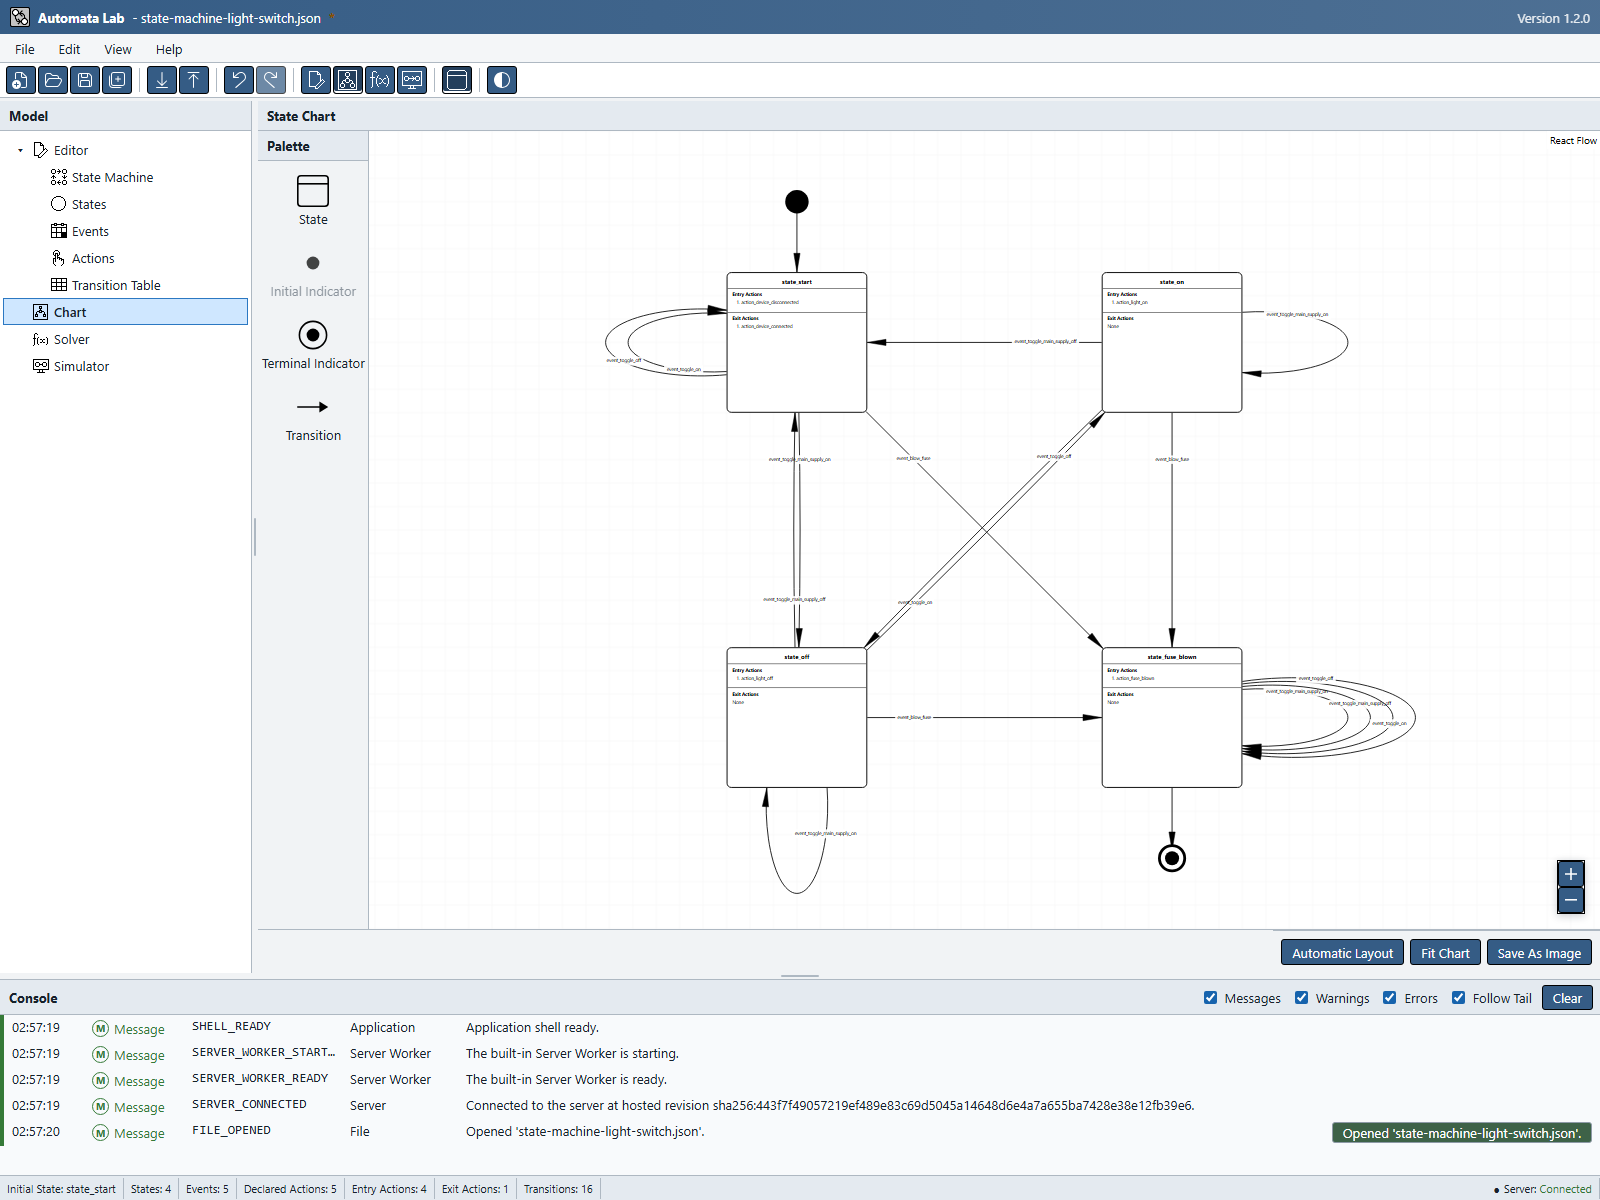
For example, detaching the end of A → B on event x leaves A → open space remembering x. Dropping that end onto C restores A → C on x. The transition returns to its former table position when possible.
Every completed detach or restore is atomic and undoable. A duplicate (state,event) key, capacity limit, invalid reference, or stale edit rejects the complete drop: the previous line position, event, attachments, and model remain unchanged. The error explains what prevented the connection. Edit Transition and the Editor Transition Table remain available for ordinary semantic edits.
Remembered events and attachments survive Save/Open and Undo/Redo. Renaming an event updates detached lines that remember it. Deleting that event keeps the line and its attachments but clears the remembered event, so completing the draft requires choosing a new event. Merely opening a file or undoing an edit never restores a transition.
Quick Connections
Select one Chart element, then Shift+left-click an eligible second element:
| Pair | Result |
|---|---|
| State, then State (including the same state) | Open Add Transition with source and destination preselected and Event empty. |
| State and Initial Indicator, in either order | Make the state initial immediately. |
| State and Terminal Indicator, in either order | Mark the state terminal and create or replace its relation immediately. |
The state-to-state direction follows selection order. All Add Transition fields remain editable, so the source and destination may be changed to the same state for a self-transition. Confirm creates one transition; Cancel changes nothing. With one eligible primary selection, Shift+Enter on the focused second element performs the same connection for keyboard users.
The state-to-state workflow uses the same fields visible in Figure UG-10, which shows the Palette attachment route to configuration.
Selection and Deletion
Click an element for primary selection or drag a selection rectangle around several elements. When Chart is active and the count is nonzero, the global status bar reports Chart Elements Selected: N.
Press Delete while Chart owns focus and focus is not inside an editable control. Chart deletion is immediate and has no confirmation dialog. A mixed semantic and visual selection is planned and deleted atomically, and one Undo restores the complete selection. Editor deletion retains its impact-confirmation workflow. Chart has no Delete button.
The state detail in Figure UG-08 shows the selection halo and resize grips.
Automatic Layout
Choose Automatic Layout to arrange states in deterministic top-to-bottom flow. It prefers the initial state as the root, then the first transition source, then the first declared state. Actual state sizes and transition-label estimates participate, and final coordinates always align to Grid Size even when interactive snapping is disabled.
Automatic Layout runs only when requested. It commits all changed geometry and cleanup as one command, so one Undo restores the complete previous layout.
The Delete Orphaned Chart Items During Automatic Layout preference controls cleanup. When enabled, layout removes orphan initial and terminal indicators and whole drafts, including lines with remembered events. It never removes configured semantic transitions or connected indicator relations. When disabled, it shelves orphan indicators outside the main graph and preserves authored draft endpoint coordinates.
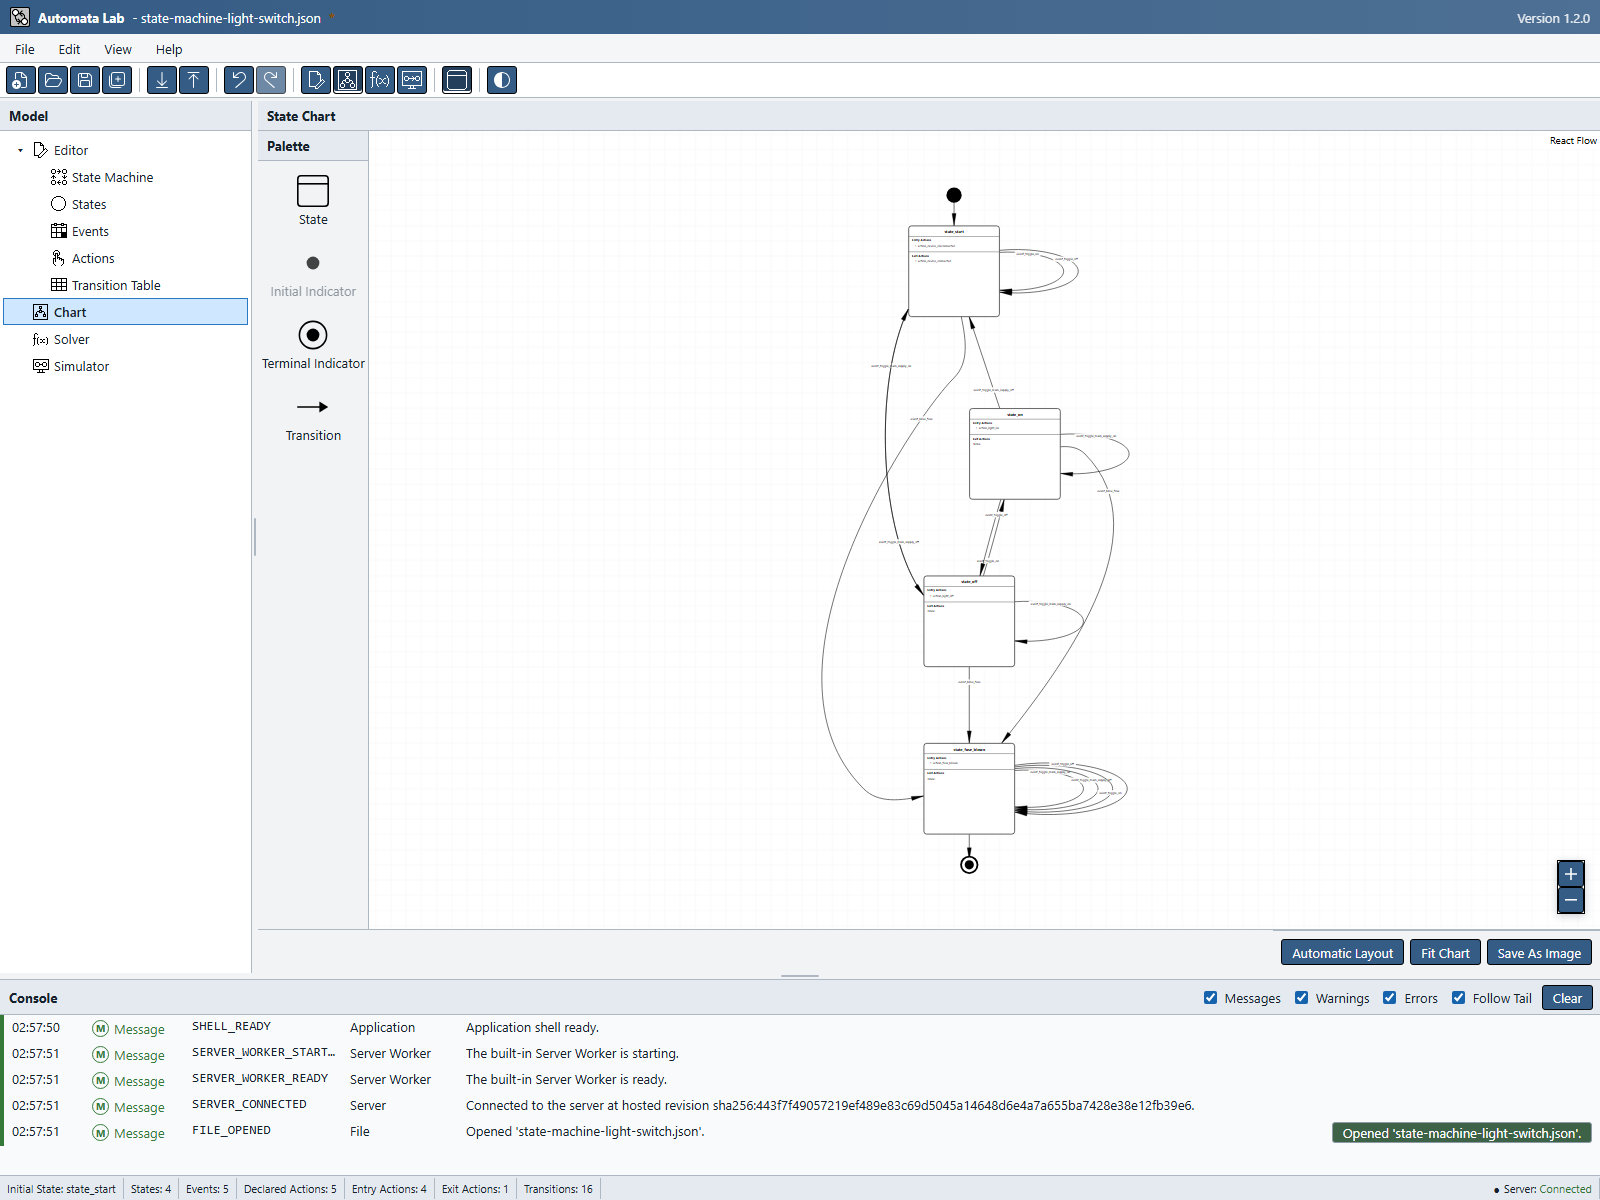
Compare Figure UG-13 with the original arrangement in Figure UG-07. Fit Chart alone would leave those original positions unchanged.
Transition Routing
Routes and labels are derived presentation state; they are never written as manual anchors or lanes in the project file. Automata Lab recomputes the complete relation set after relevant geometry, sizing, wrapping, or routing-preference changes.
Ordinary transitions avoid state, indicator, and accepted-label obstacles. Clear direct relations render as straight cubic curves; obstacle detours, parallel and reciprocal lanes, and self-transition loops add curvature only where needed. Event labels use the configured Start, Center, or End alignment and move among deterministic positions to avoid collisions.
If bounded route or label search cannot prove a normal placement, the relation stays visibly solid and uses a deterministic exterior fallback. An accessible description and Console diagnostic report the condition. Routing never mutates the document, and a failed or stale routing request leaves the current preview visible.
Selected states have a 4-pixel-wide gray halo outside and behind their normal border. The gray is lighter in Light mode and darker in Dark mode; the state border, fill, size, and text layout remain unchanged. Selected transition curves are 6 pixels thick and retain their normal line color in Light mode. Transition endpoint grips are circles filled with the same theme color as states, independently of both button-color settings. Configured transition circles measure 16 pixels across; draft circles measure 24 pixels. These dimensions scale with Chart zoom.
In Light mode, chart state outlines, compartment separators, text, initial/terminal notation, transitions, arrowheads, and grip outlines are black. State and grip interiors retain their light surfaces; the gray state-selection halo remains unchanged. Expanded-state resize grip borders are 2 CSS pixels in both themes, matching unselected state borders. Forced colors continues to use system colors.
Zooming, Panning, and Fit Chart
Use the Canvas zoom controls or mouse wheel to zoom; editable Chart zoom reaches 10 percent. Pan the Canvas to move the viewport without moving model elements. Fit Chart changes only the viewport so the complete diagram fits the available Canvas.
Zoom, pan, and Fit Chart do not change project coordinates, revision, dirty state, or Undo history. Automatic Layout is different because it intentionally commits new document geometry and then fits the result. Both buttons work by pointer or keyboard; Home does not fit the editable Chart.
A successful File Open or Server Pull also requests one fit on your first visit to Chart. If you visit another page first, that fit waits until you enter Chart. It is not repeated by later edits or navigation. Failed or cancelled Open/Pull does not request fitting, and New or Close clears any waiting request. New empty files start at 100 percent.
Pan, zoom, and a waiting fit request are temporary application state, not saved project data. The current view survives edits and navigation to other UI areas. Returning to Chart restores your last translation and zoom, including a view set by Fit Chart. New or Close clears the remembered view; a successful Open or Pull fits the replacement document once.
Saving the Chart as an Image
Choose Save As Image to capture one non-mutating snapshot of the complete Chart. The command uses the settings already committed under Application Settings → Chart → Image Export and opens one format-specific save picker, or performs one download when the browser cannot retain a file destination.
The image contains complete Chart bounds, one grid unit of padding, nodes, routed relations, arrowheads, labels, the current theme, and the grid only when Show Grid is enabled. It excludes the Palette, Canvas controls, attribution, action panel, selections, focus outlines, endpoint controls, and resize handles.
PNG and JPG use the configured unit and DPI. Before allocating a raster bitmap, Automata Lab rejects output above the configured Maximum Megapixels limit. SVG remains vector, contains inert text and no active or external content, and does not consume the pending DPI or megapixel values. Cancelling the picker makes no project or Console change.
Check the Image Export settings screenshot before choosing Save As Image.
Chart Keyboard Operation
Tab to Chart elements and controls, and use Enter or Space on focused states, drafts, and semantic transitions to open their edit workflows. Shift+Enter provides eligible quick connections. Arrow-key movement uses bounded steps; with Snap to Grid enabled it moves by one grid unit, or four units with Shift. Use Alt+Up/Down on an expanded state resize edge, adding Shift for the larger step.
Palette placement itself is intentionally drag-only. Keyboard users can create and edit the complete semantic model in Editor, configure transitions through dialogs, operate Chart selection and movement, connect indicators, and use every bottom command without relying on pointer-only semantic behavior.
Previous: Editor
Next: Solver